Interest Rates: The Old Normal

Interest rates are likely transitioning to a new normal, which is different from the old normal. In other words, all of the projections that assume rates will be getting back to normal are wrong—because the definition of normal has changed.
Change is rarely a quick process, though. Often, it can be so slow that you don’t notice it until the change is quite big. The grass in my yard, for example, doesn’t seem to grow until the weekend, when it suddenly needs cutting. The same idea has been true for interest rates, which have been dropping for decades.
Looking at the Long Term
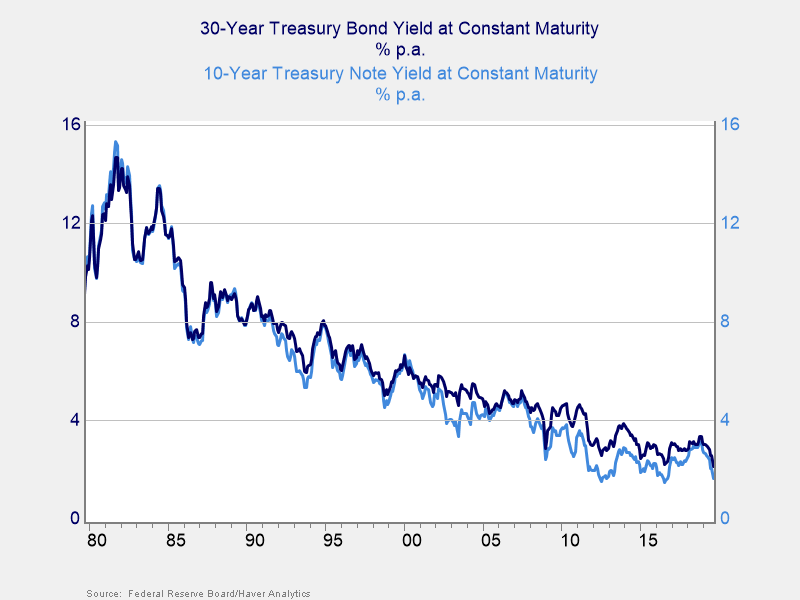
Note the long term trend is very clear. During the past 40 years or so, however, there have been ups and downs. Over a period of 5 to 10 years, the trend is much less clear.

There are a couple of takeaways from the chart above. Most current investors had their formative years in the 1990s and 2000s, with some going back to the 1980s. During that time period, rates were typically in the 4 percent to 8 percent range, which is what most of us at a senior level now think of as normal. You can see that idea of normal quite clearly in analyst projections of where rates are likely to go, as almost all of them put rates back into that range over some time period. The bias of “what I grew up with” is a strong one. But as you can see, that idea of normal was not very normal at all. My younger colleagues, for example, have seen rates of 2 percent to 3 percent as normal for all of their careers. Is that the new normal?
What Does Recent Data Say?
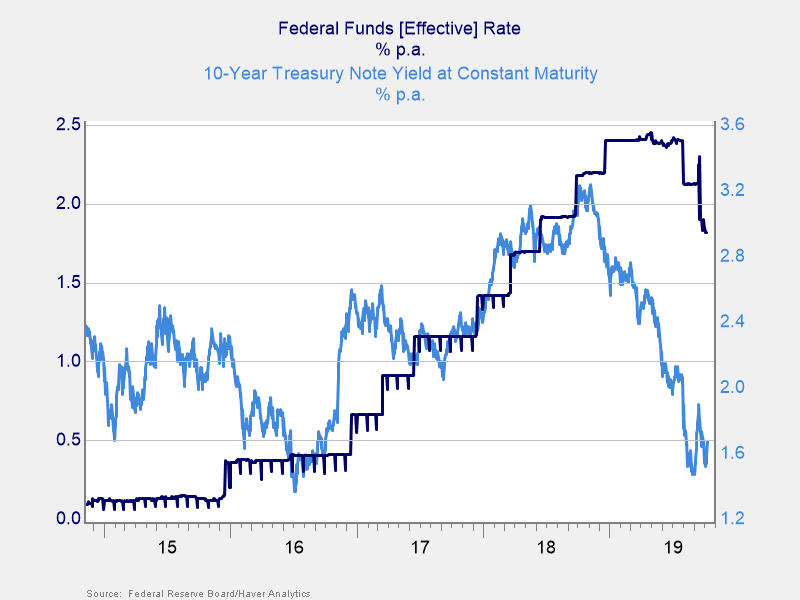
That range might be the new normal, based on the most recent data. That 40-year chart is compelling, but recent data looks a bit different. In 2016, the Fed started raising rates, and the 10-year rate followed suit. From 2016 through 2018, it looked like we were headed back to the normal 4 percent to 6 percent that people of my age (who, not coincidentally, run the Fed) expected. But then, in late 2018, something happened. While the Fed kept its rates up, the 10-year collapsed again. Normal once again looked not so normal. Rather than the Fed setting interest rates, it is now responding to the market by cutting. Whatever the new normal is, it is more powerful than the Fed—so we have to take it seriously.

What does this shift mean for the future? Is there a new normal? How do we tell? And what will it be? Clearly, the expectations that rates would rise back to normal is, at least, uncertain.
Not Just a U.S. Story
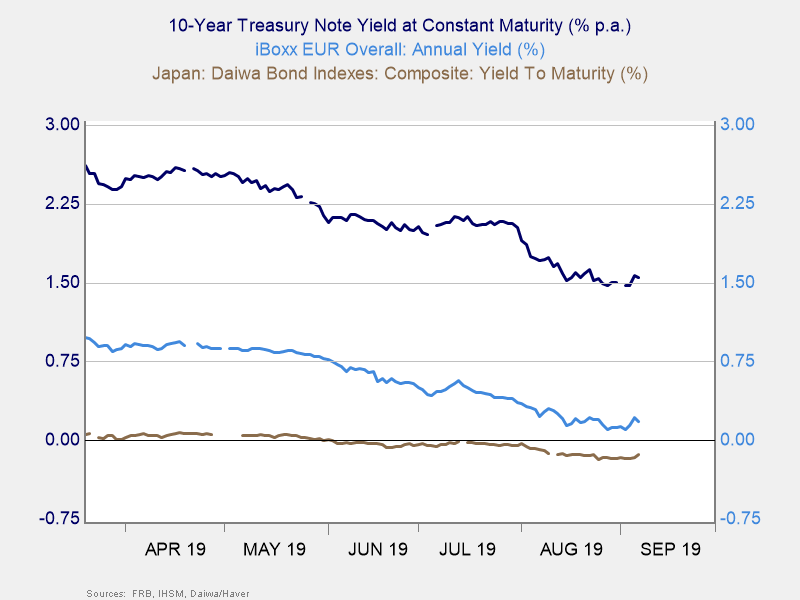
Around the world, we see rates both very low by historical levels (after decades of declines) and down substantially in the past 6 to 12 months. Whatever is going on is happening around the world, and any explanation needs to account for that. Beyond that, our explanation needs to account for why rates are so different between area markets. As the chart below shows, U.S. rates are well above European rates, which are well above Japanese rates, which are below zero collectively. We need some kind of explanation as to why that should be. In economic theory, in a global capital market, rates should converge, which isn’t happening. In economic practice, normal rates are assumed, and that isn’t happening either.

Where We Are (and Where We Might Be Going)
Rates have been dropping for decades. Normal, as many of us think about it, isn’t happening—and isn’t likely to happen. On top of that, different areas have very different interest rates; based on economic theory, this shouldn’t happen. Economics doesn’t give us good guidance as to what is happening—or what is likely to happen.
So, maybe something else is going on. Tomorrow, we will take a look at the different ways that interest rates may be set to start to figure out what that "something else" might be.
Editor’s Note: The original version of this article appeared on the Independent Market Observer.
The information on this website is intended for informational/educational purposes only and should not be construed as investment advice, a solicitation, or a recommendation to buy or sell any security or investment product. Please contact your financial professional for more information specific to your situation.
Certain sections of this commentary contain forward-looking statements that are based on our reasonable expectations, estimates, projections, and assumptions. Forward-looking statements are not guarantees of future performance and involve certain risks and uncertainties, which are difficult to predict. Past performance is not indicative of future results. Diversification does not assure a profit or protect against loss in declining markets.
The S&P 500 Index is a broad-based measurement of changes in stock market conditions based on the average performance of 500 widely held common stocks. All indices are unmanaged and investors cannot invest directly into an index.
The MSCI EAFE (Europe, Australasia, Far East) Index is a free float‐adjusted market capitalization index that is designed to measure the equity market performance of developed markets, excluding the U.S. and Canada. The MSCI EAFE Index consists of 21 developed market country indices.
Third-party links are provided to you as a courtesy. We make no representation as to the completeness or accuracy of information provided at these websites. Information on such sites, including third-party links contained within, should not be construed as an endorsement or adoption by Commonwealth of any kind. You should consult with a financial advisor regarding your specific situation.
Please review our Terms of Use.


