Bringing the 60/40 Portfolio Back to Life

Over the past few years, many people have been looking for alternatives to the 60/40 portfolio (a portfolio allocation of 60 percent equities/40 percent fixed income)—and for good reason. The Fed’s massive intervention to lower interest rates made the 40 percent allocation to fixed income in the 60/40 portfolio much less attractive. With inflation reaching levels we haven’t seen in decades and the Fed set to push interest rates higher, people have been wondering whether fixed income still provides the protection of principal that many investors are looking for. The Bloomberg U.S. Aggregate Bond Index’s worst quarter in more than two decades has certainly increased this concern. This pain, however, has put fixed income in a much healthier position going forward, with higher starting yields able to cushion investors from further declines in price.
Why Use the 60/40 Portfolio?
In the context of a 60/40 portfolio, fixed income is meant to lower the volatility of an all-equity portfolio while still allowing the investor to seek a reasonable rate of return. In the long run, equities should outperform fixed income, so if growth was the only long-term concern, investors would end up with equity-only portfolios. For many investors, though, volatility is also a concern, so fixed income plays a large part in the portfolio.
This is why the 60/40 portfolio became a popular and balanced investing strategy. But when rates fell to very low levels, we saw that fixed income investors were concerned with two things:
Portfolios wouldn’t generate high enough returns.
There was a higher risk of rates rising than falling, so fixed income wouldn’t provide the same downside protection as in the past.
This led to some investors implementing several different strategies in order to address these concerns.
60/40 Alternatives
To tackle low return expectations, investors may have adjusted their 60/40 allocation to include more equities, moved into more illiquid products like private equity or private credit, or adjusted their 40 percent allocation to include higher-risk areas of the fixed income market. Each of these options has its trade-offs, but all of them add risk to the portfolio. This assumed that the investor could have taken on that risk or that the risk of those asset classes wasn’t a concern with the support of fiscal and monetary policy.
For investors worried that fixed income wouldn’t protect on the downside, they may have moved into bonds with shorter maturities to protect against rising rates, used derivatives to help protect against a market downturn, or added commodities to help hedge against rising inflation. Looking ahead, each option has its drawbacks, so traditional fixed income may provide better relative value than these alternatives.
Getting Back to Neutral
Both strategies listed above offer tools to address certain market conditions and provide an argument for making changes to your allocation when market conditions change. But portfolios should have a target allocation that can be met under “normal” circumstances. While both equity and fixed income suffered during the first quarter, a balanced 60/40 approach may still make sense as a moderately aggressive portfolio for some investors. The equities can provide upside potential, while fixed income can help protect on the downside while still offering the chance for a positive yield.
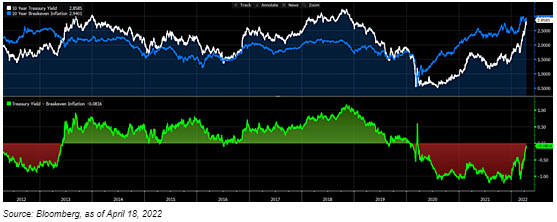
Both equities and bonds fell in the first quarter as real yields and inflation expectations rose; this was an uncommon combination since rising real yields would be expected to slow inflation. The chart below is one of my favorites to show what level of interest you can expect after inflation. The white line is the 10-year Treasury, the blue line represents 10-year inflation expectations, and the bottom panel shows the difference, which represents the real rate of interest.

In the bottom panel, it’s apparent that real interest rates are close to zero and very close to pre-pandemic levels. Looking at the components of real rates, we see that inflation expectations (the blue line) are the highest they’ve been in the past 10 years, while nominal rates are less than 50 bps from their 10-year high, a level that was maintained only briefly before the pandemic. This rate spike is likely causing many to question whether the conservative investments they’ve been investing in are actually conservative.
The speed at which rates rose caused the pain in the first quarter, but it will be difficult for the market to repeat that spike given that it has priced in a significant number of Fed rate hikes. While it’s certainly possible for the Fed to become even more hawkish and inflation to remain stubbornly high, these risks are starting to be balanced out by the possibility of a recession or a slowdown in growth.

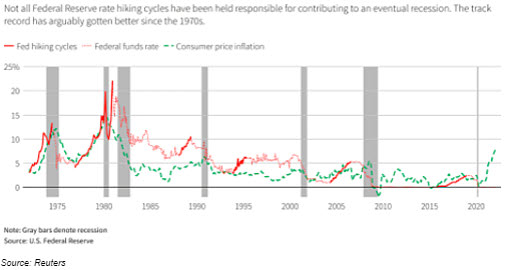
Another concern is that the Fed won’t be able to engineer a soft landing (i.e., bring down inflation without causing a recession). Looking back, you can see in the graph above that recessions have followed hiking cycles several times, so this could be a scenario where fixed income might benefit. On the other hand, there have been positive examples of soft landings as well, such as in 1994 (when the Fed doubled interest rates in just 12 months) and the most recent cycle starting in 2016. With companies and consumers in great shape, a soft landing is a good possibility and one where equities could perform well, which would help offset any potential weakness of fixed income.
Looking Forward, Not Backward
The benefits of a 60/40 portfolio are due to the historic track record of low correlation between bonds and equities described above, which prepares it for a broad range of outcomes. We don’t want to only prepare for what just happened, especially in a very infrequent scenario. So, while the alternatives to a 60/40 portfolio can be useful tools in the toolkit, if rates are moving back toward neutral, as always, investors should take a long-term perspective; consider their investment objective, risk tolerance, and investment goals; and decide whether moving back to neutral makes sense for them.
Investments are subject to risk, including the loss of principal. Some investments are not appropriate for all investors, and there is no guarantee that any investing goal will be met.
Editor’s Note: The original version of this article appeared on the Independent Market Observer.
The information on this website is intended for informational/educational purposes only and should not be construed as investment advice, a solicitation, or a recommendation to buy or sell any security or investment product. Please contact your financial professional for more information specific to your situation.
Certain sections of this commentary contain forward-looking statements that are based on our reasonable expectations, estimates, projections, and assumptions. Forward-looking statements are not guarantees of future performance and involve certain risks and uncertainties, which are difficult to predict. Past performance is not indicative of future results. Diversification does not assure a profit or protect against loss in declining markets.
The S&P 500 Index is a broad-based measurement of changes in stock market conditions based on the average performance of 500 widely held common stocks. All indices are unmanaged and investors cannot invest directly into an index.
The MSCI EAFE (Europe, Australasia, Far East) Index is a free float‐adjusted market capitalization index that is designed to measure the equity market performance of developed markets, excluding the U.S. and Canada. The MSCI EAFE Index consists of 21 developed market country indices.
Third-party links are provided to you as a courtesy. We make no representation as to the completeness or accuracy of information provided at these websites. Information on such sites, including third-party links contained within, should not be construed as an endorsement or adoption by Commonwealth of any kind. You should consult with a financial advisor regarding your specific situation.
Please review our Terms of Use.


